Tr33man Indicators
Bubble Chart
“I use a lot of tools, but this one actually adds clarity. Seeing sector flow and correlation mapped visually saves me time" -arete-trading
Visualize market structure and sector flow in real time
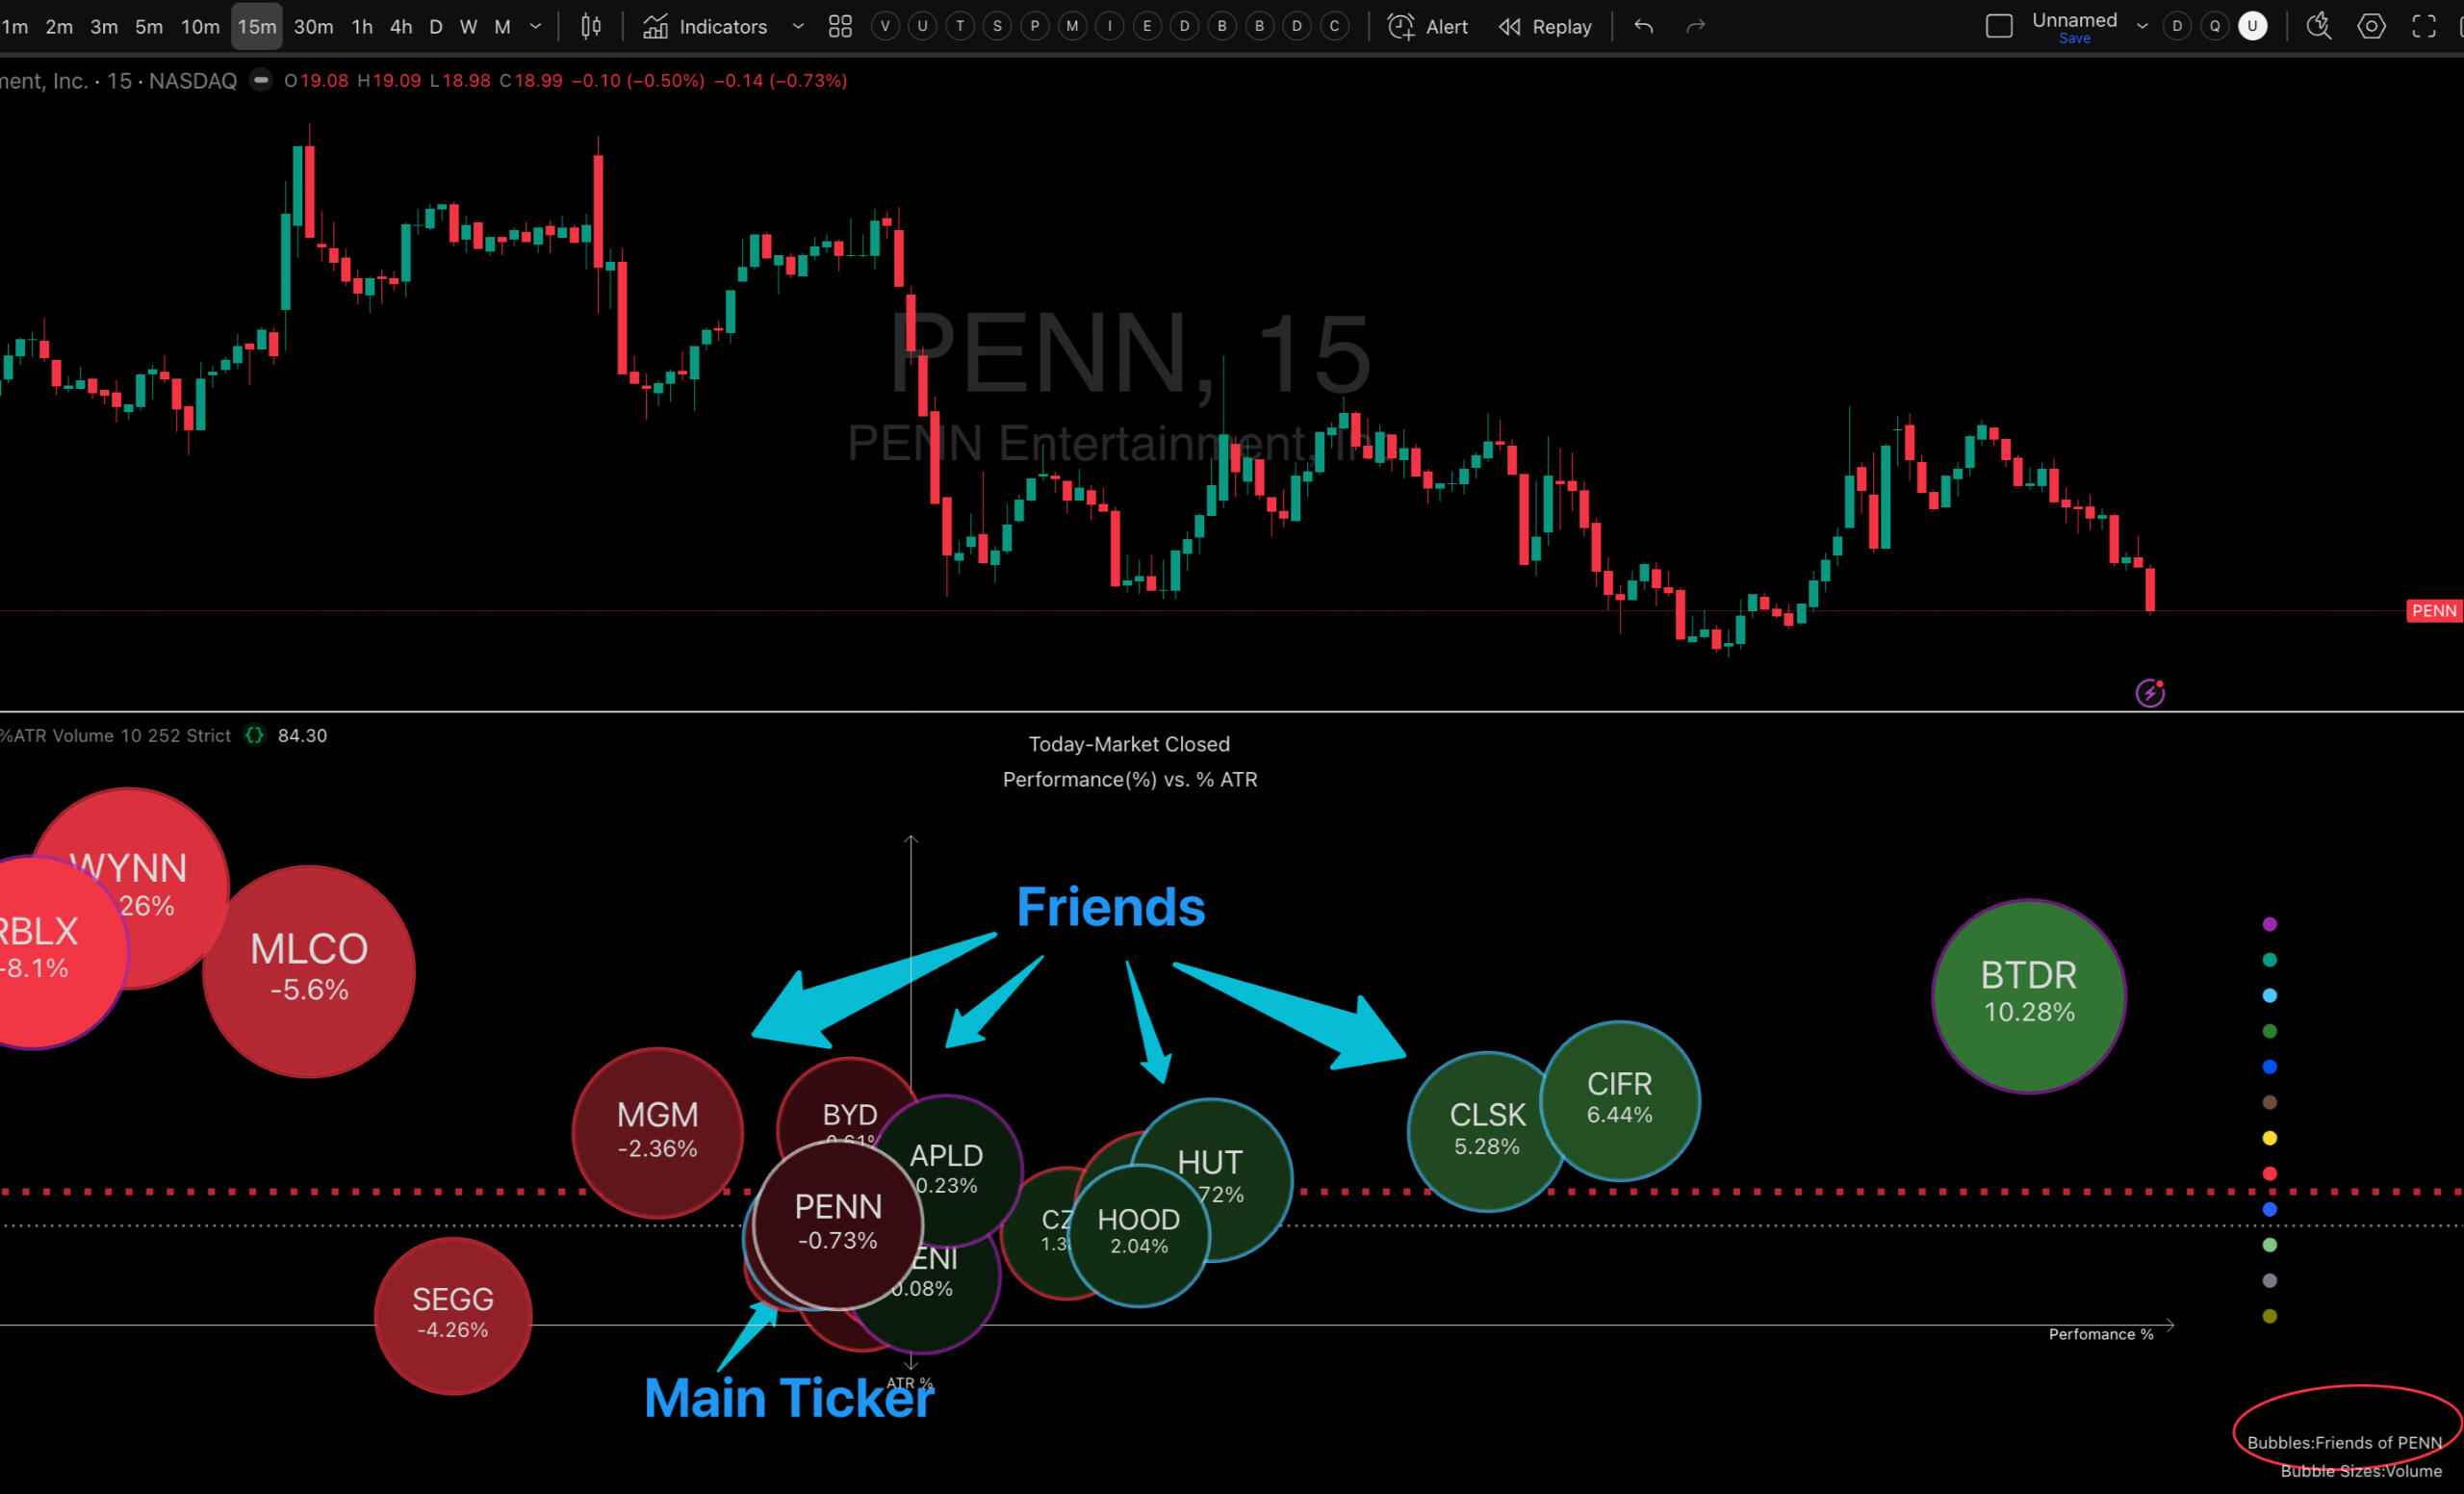
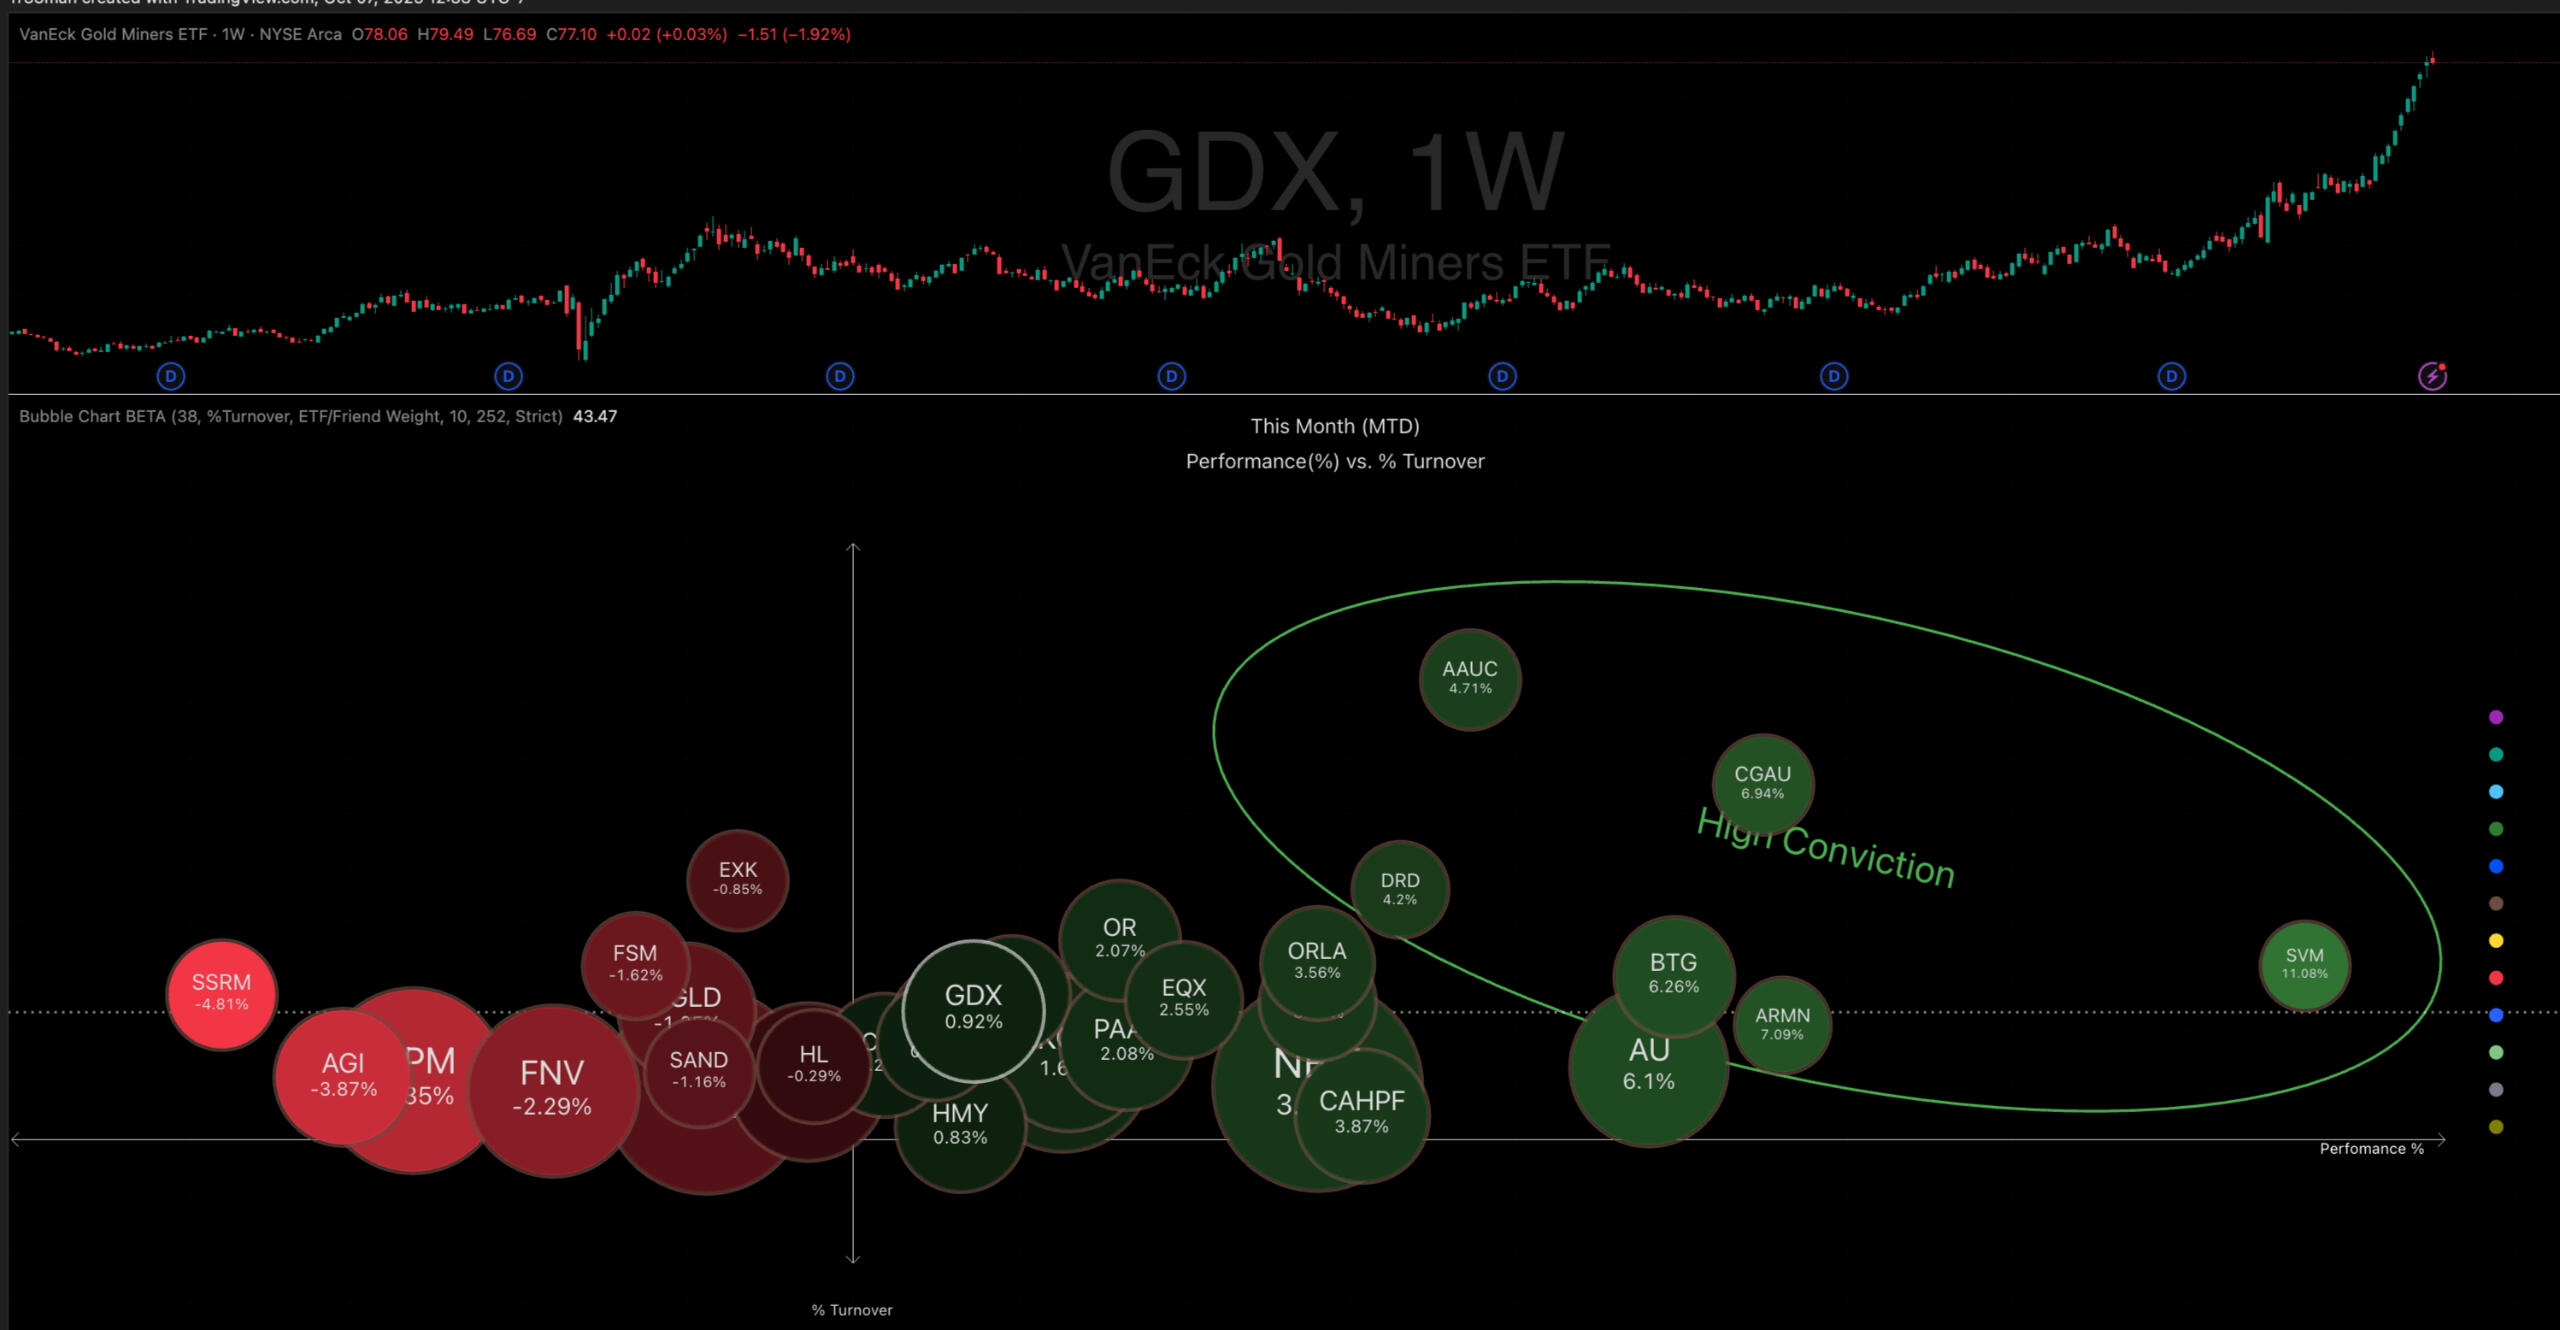
Bubble Chart maps every stock or ETF together with its most relevant peers—based on shared ETF holdings—so you can see performance, conviction, and volatility in one glance.
Why traders use it
• 143 ETFs & 3,300 stocks analyzed
• “Friends” network highlights correlated tickers
• Instantly spot extremes, momentum shifts, and clusters
• Time-aware: today / week / month / year views
The free version of this indicator is located at: HERE
Bubble Chart Lite: Up to 5 Bubbles
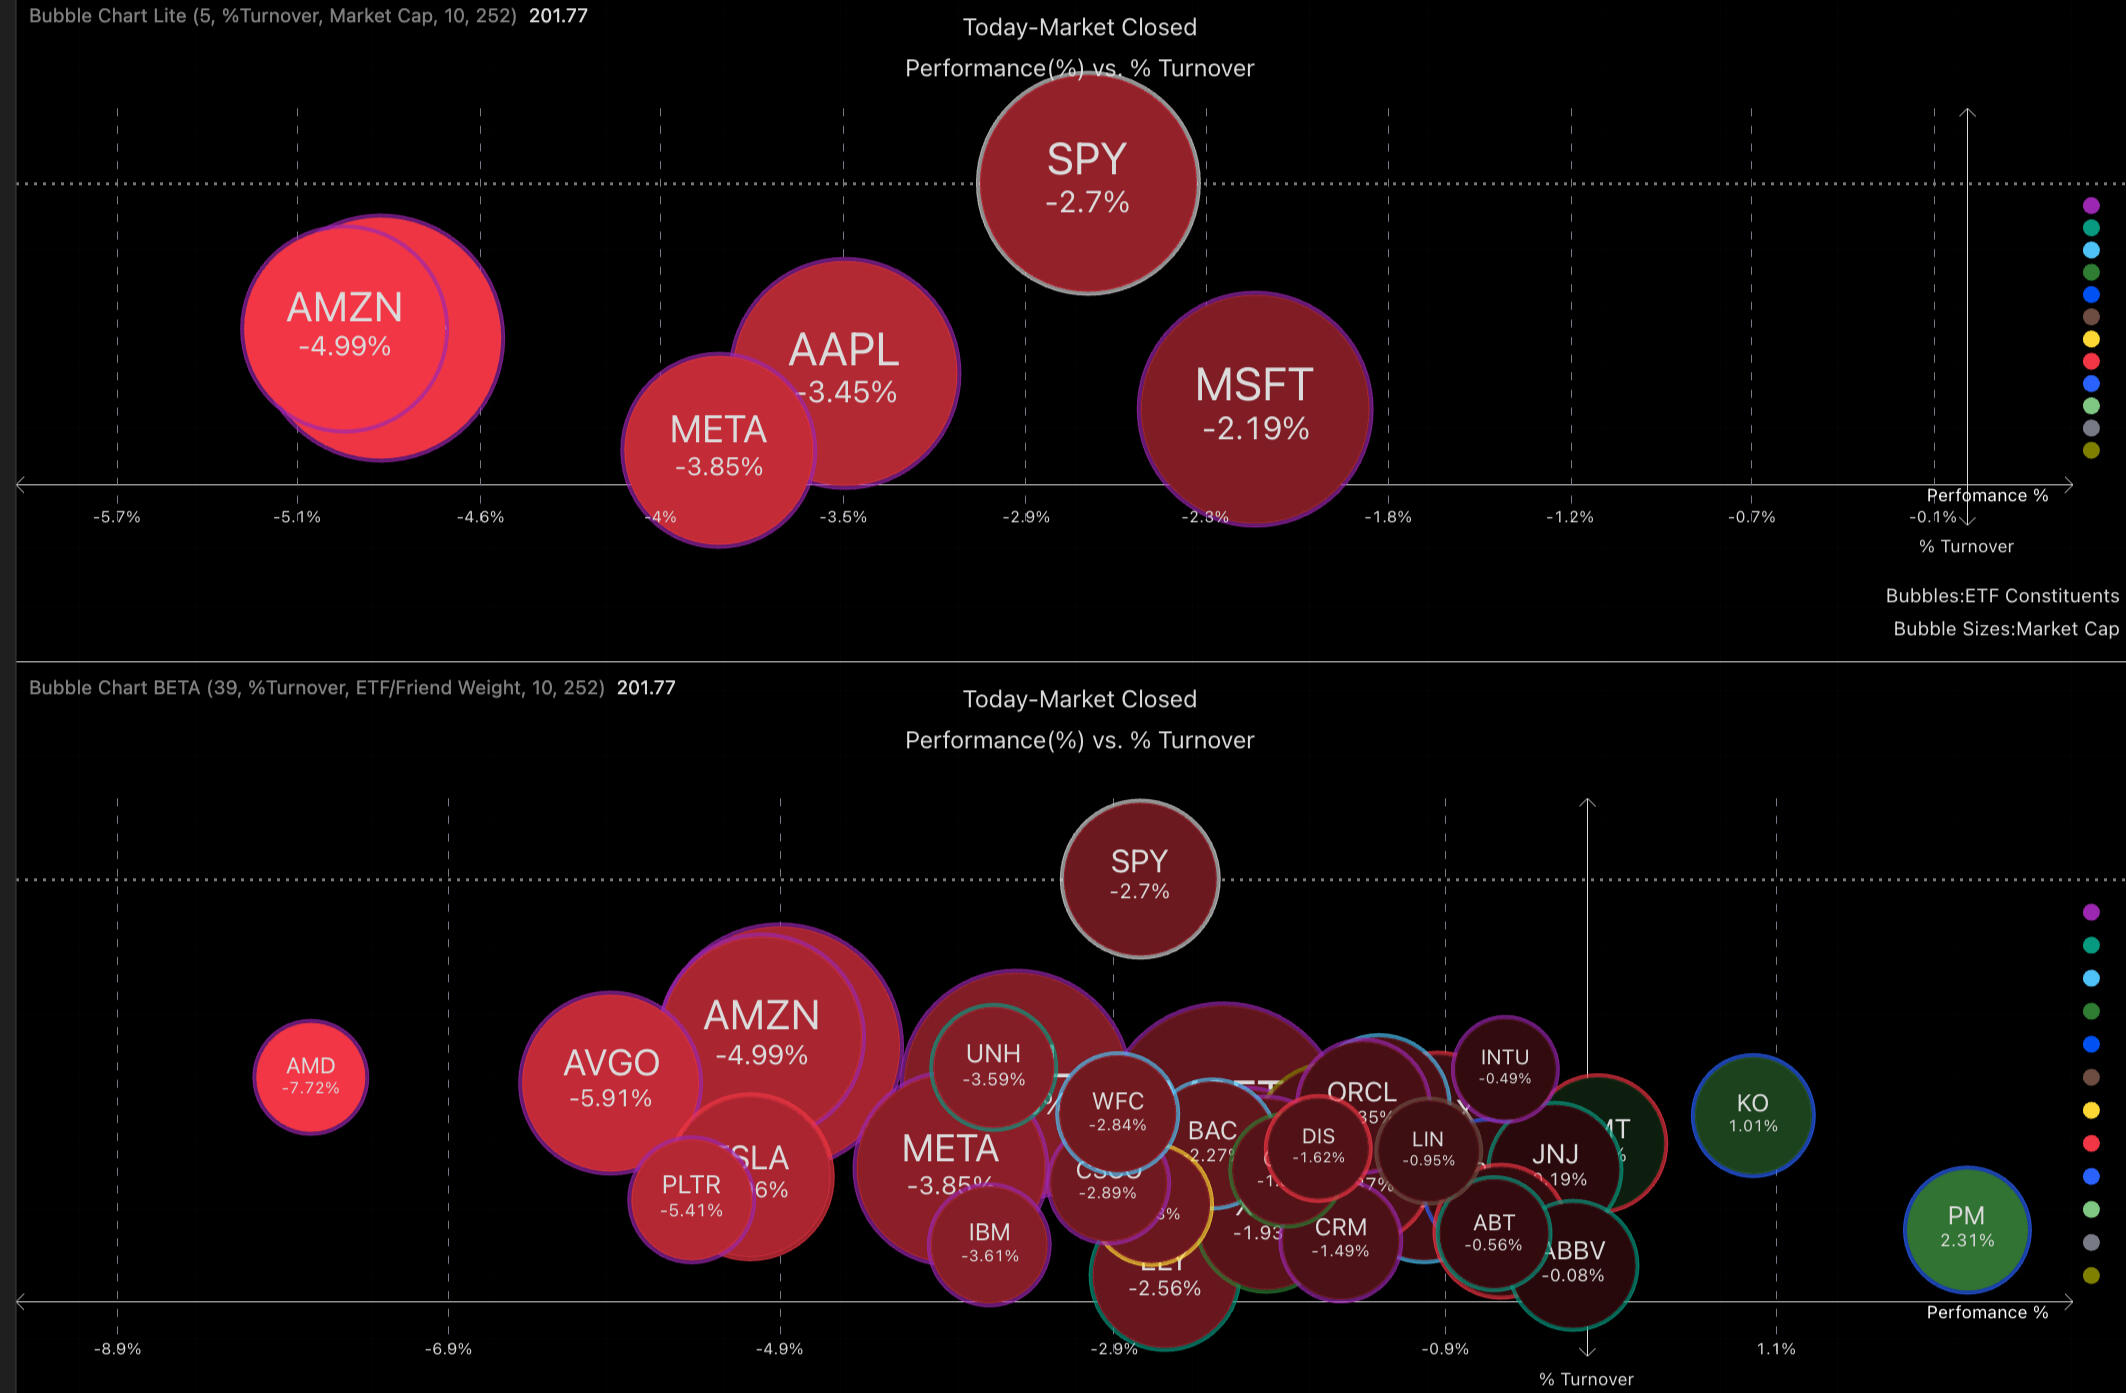
Same Bubble Chart with 25 Bubbles:
seeing the market structure
"The Bubble Indicator is amazing, I can instantly tell which sector or stock is moving on the day as well as where funds are moving to. I use this as my main indicator to pick stocks for the day" -Dey_T
How it works
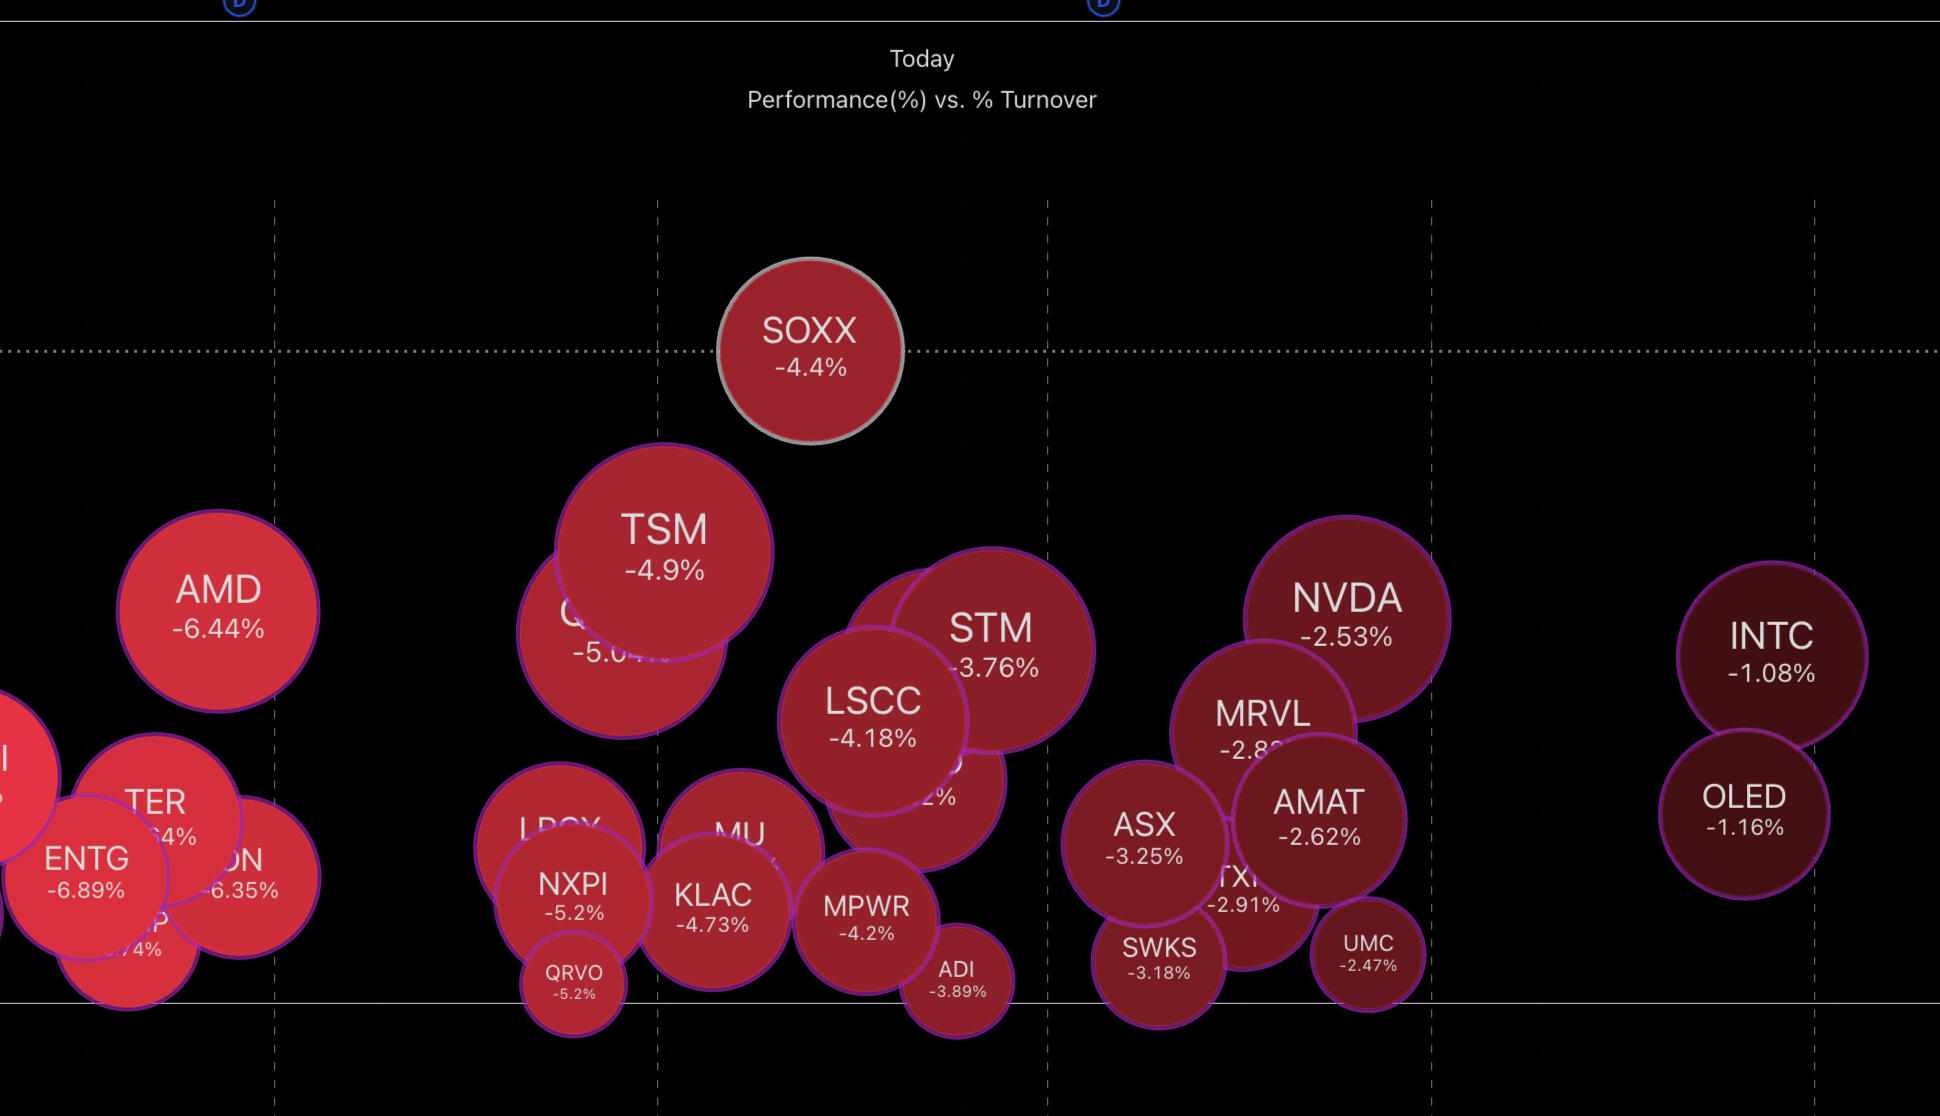
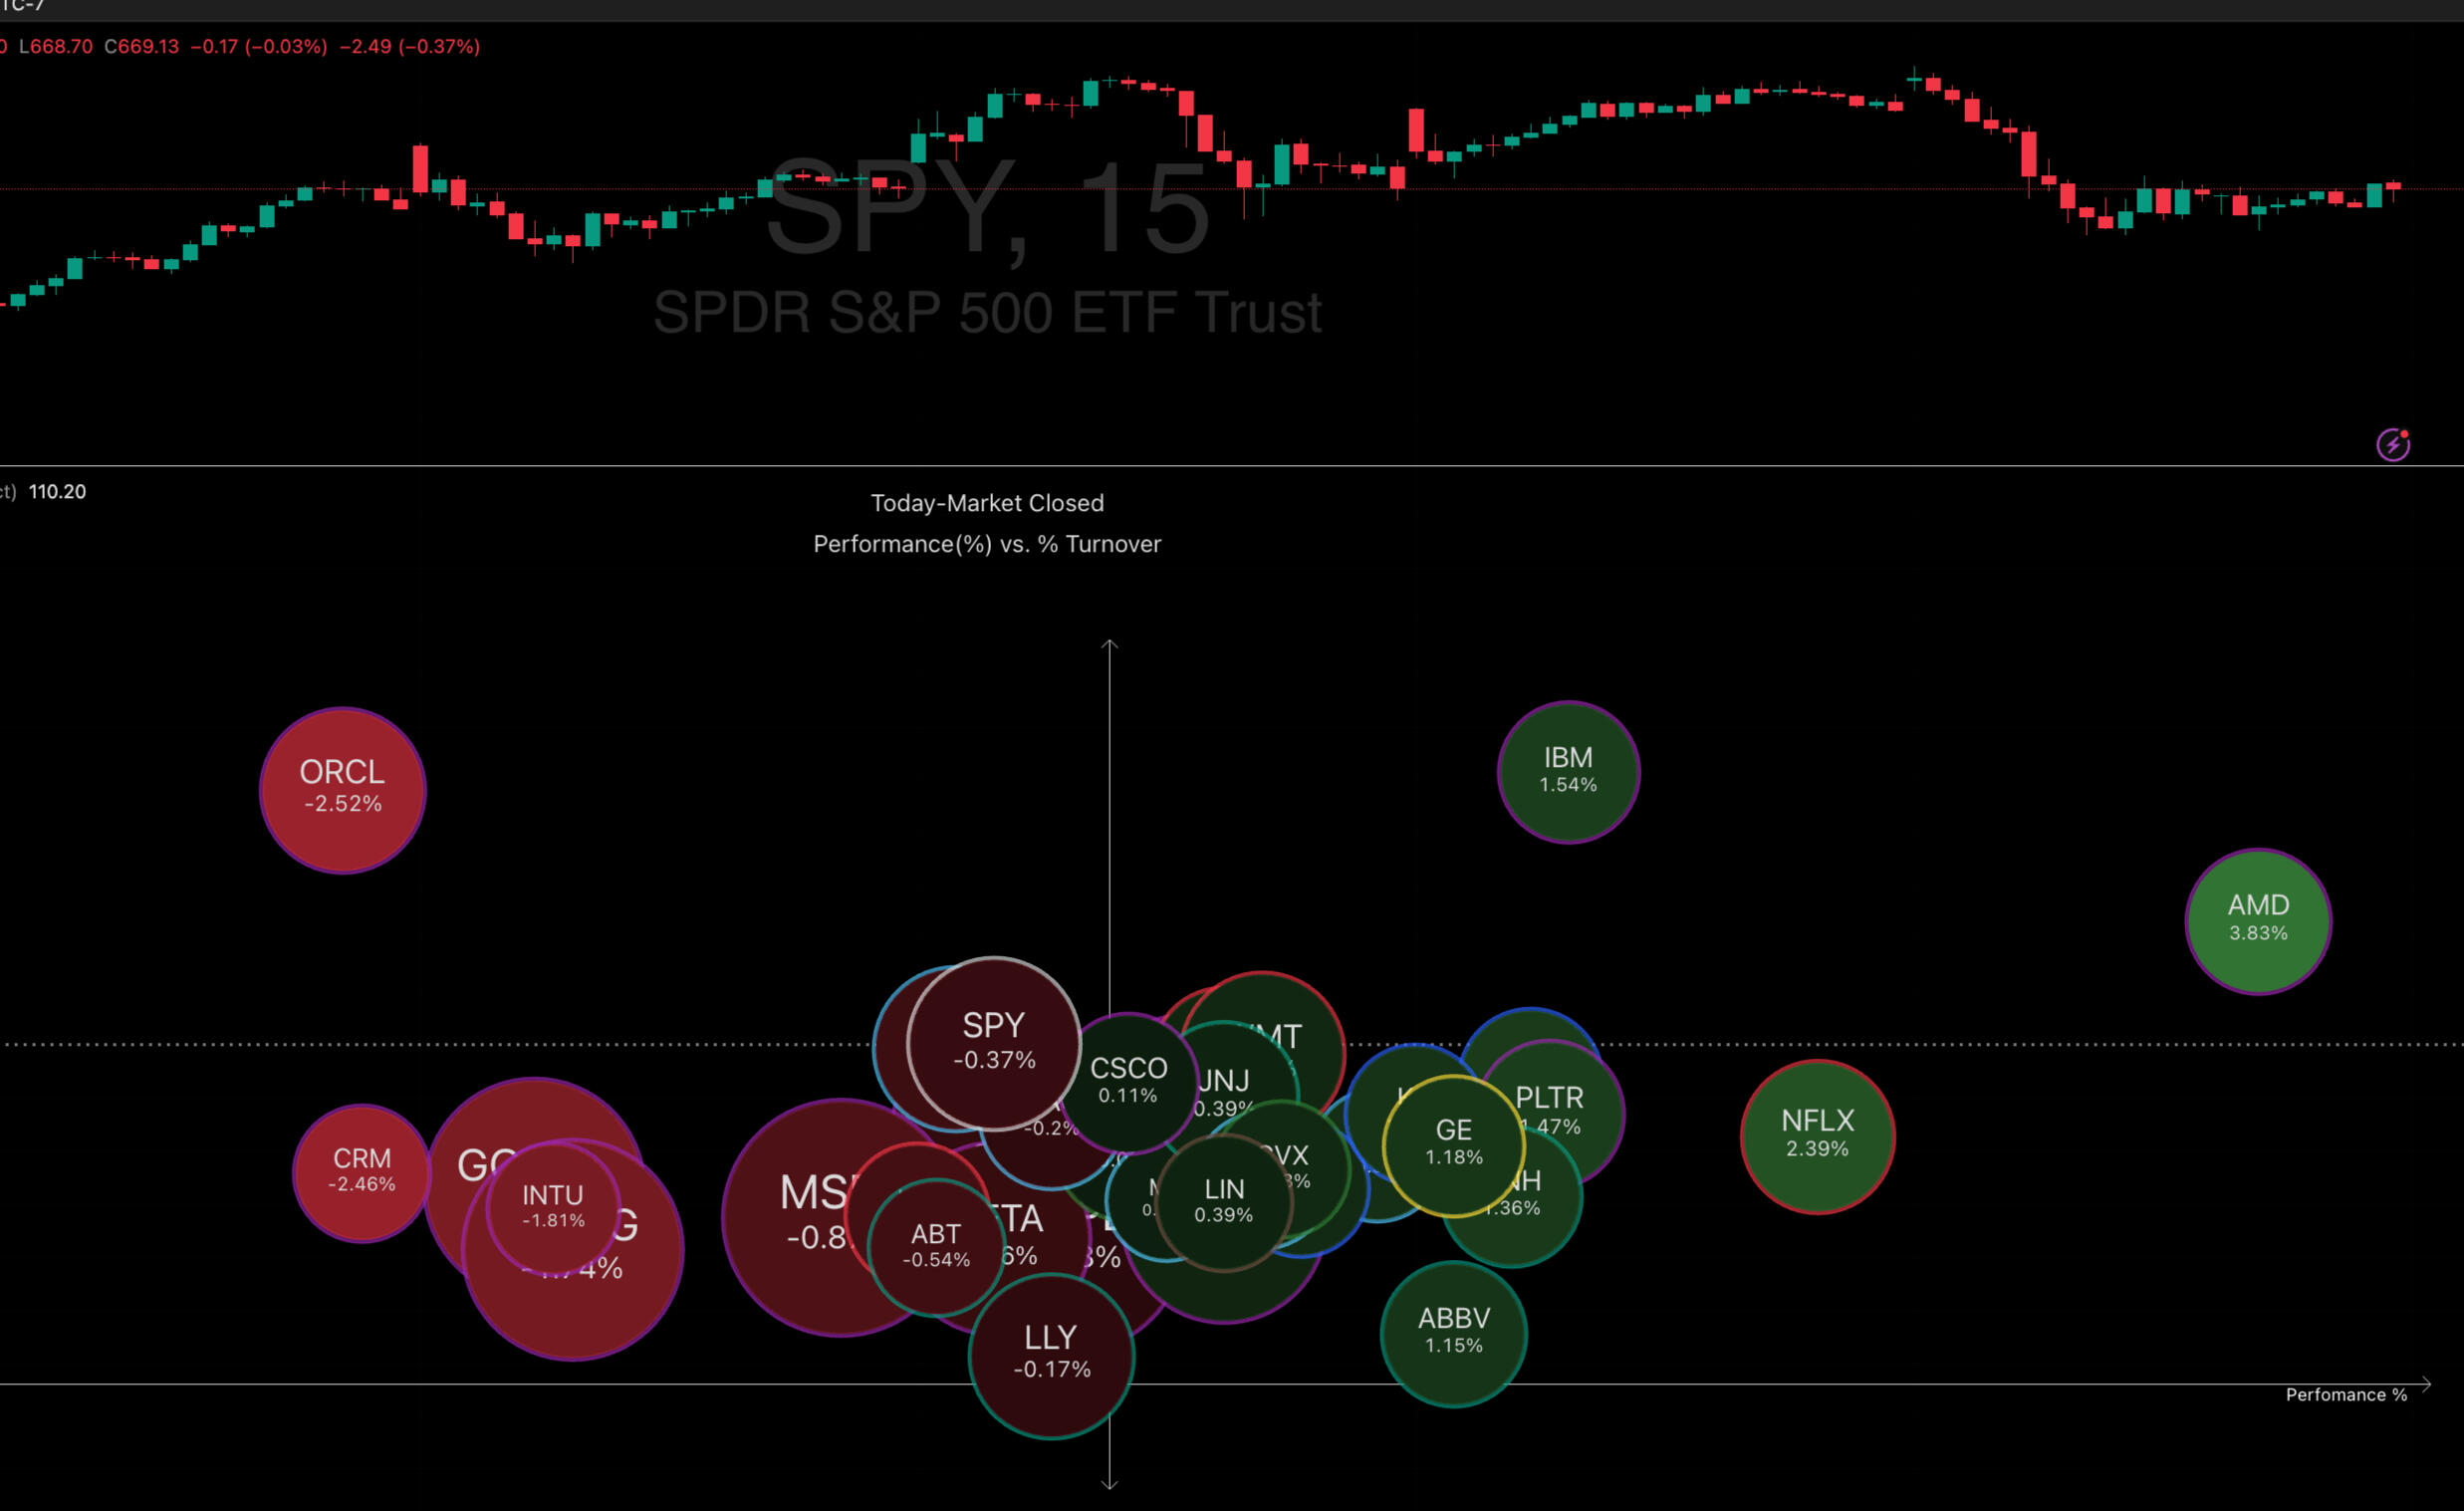
Each bubble = one security
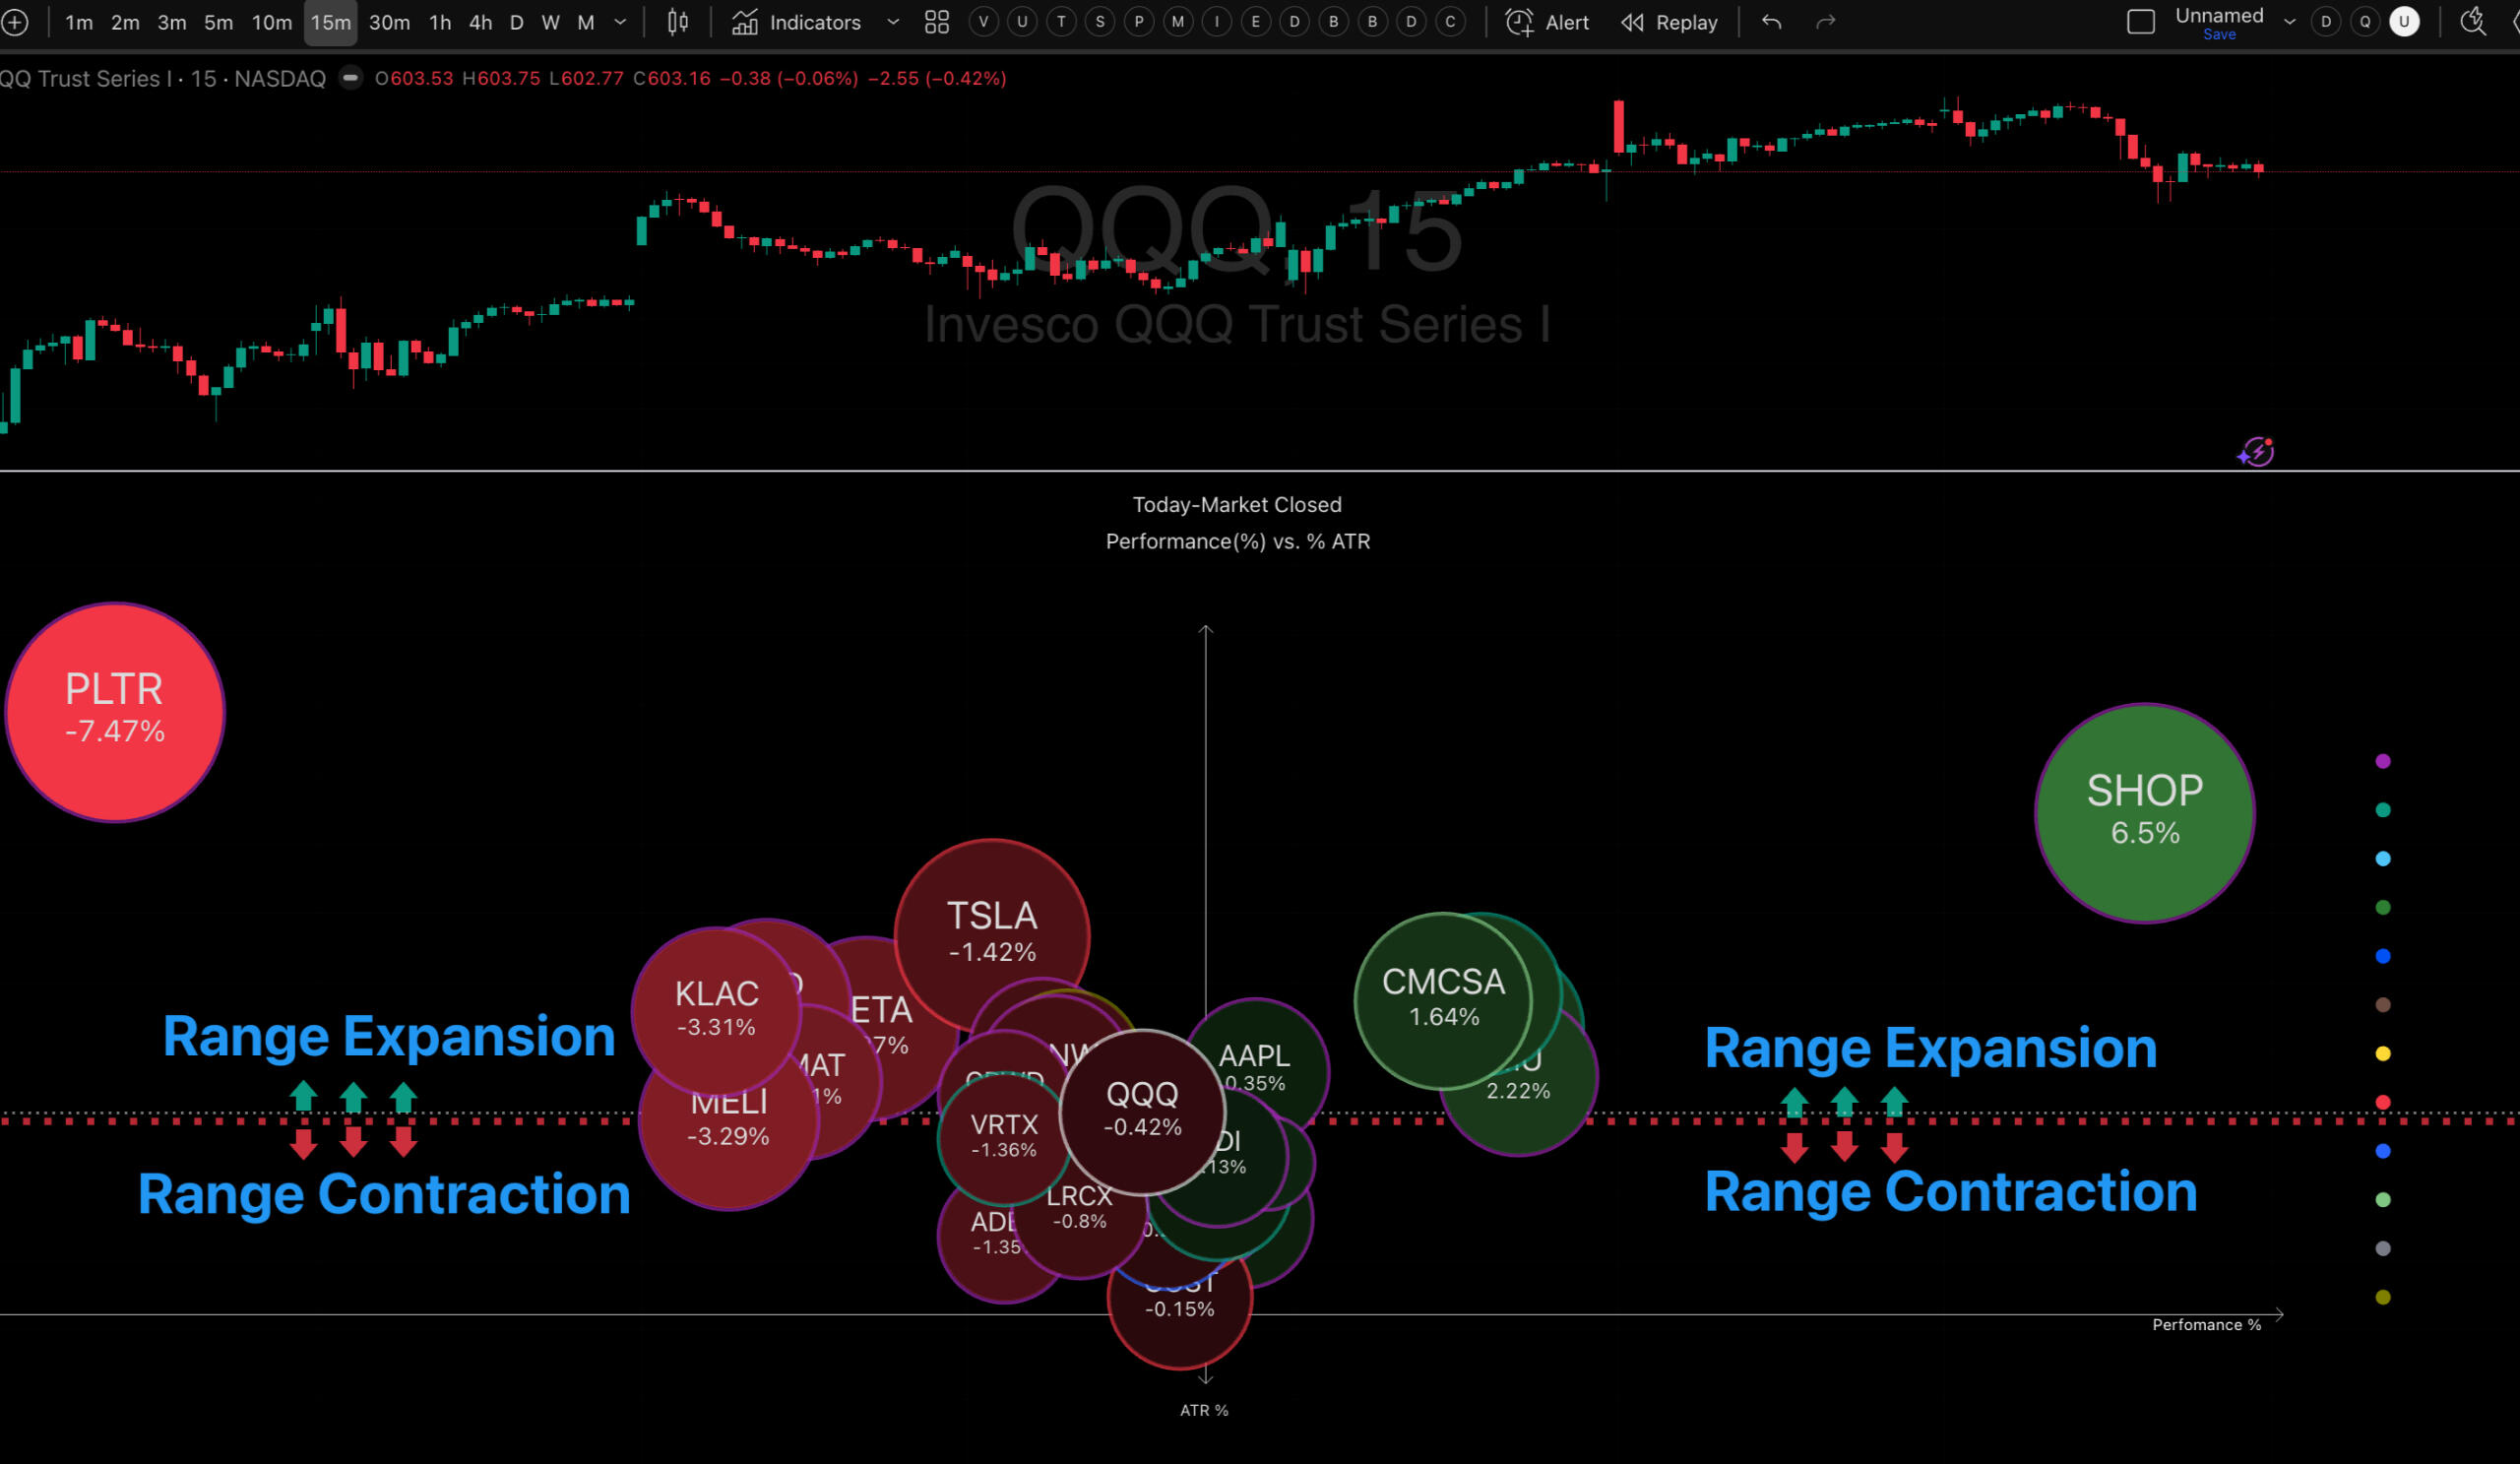
• X-axis: performance (% change)
• Y-axis: conviction, volatility, Z-scores, or 52-wk range
• Size: market cap or % volume
• Border color: sector
"i've been using Bubble Charts to find stocks performing in the ETFs it covers. Helps me find stocks I may not have on my radar. It works amazingly" -kamaatakh
Full Access unlocks
With only 5 bubbles, these questions are guesswork. With up to 39, they're visual:
- Is today's move broad-based or concentrated?
- Which Sectors are driving the market right now?
- Which tickers are extended vs lagging?
- Where is momentum accelerating or fading?
- Are these moves likely to mean-revert or continue?
- Are these moves confirmed by Friends network?
| Bubble Chart Lite | Bubble Chart |
|---|---|
| Up to 5 bubbles | Up to 38 bubbles |
| See top weighted stocks | See market structure |
| All visualization features | All visualization features |
| Perfect for testing concept | Essential for market analysis |
$25/month = Less than one prevented bad trade
• Cancel anytime
Start seeing market structure today
How it works:
1. Subscribe ($25/month)
2. Submit your TradingView username (modal appears after payment)
3. Get whitelisted within 24 hours
4. Access "Bubble Chart" indicator in TradingView
Tr33man does it again 🔥
After the game-changing ATRz indicator, the Bubble Chart indicator instantly shows where momentum’s building. No more scanning for volume or % change.
Powerful, simple, and perfect for spotting both day-trade and swing setups. 🎯" -JeanniusK
Disclaimer: Bubble Chart is a market visualization toolfor educational purposes. This is not investment advice. Trading involves risk. Past performance does not guarantee future results. You are responsible for your own trading decisions.
Contact: [email protected]
Tr33man Indicators
Terms of service
Effective Date: October 10, 2025
Last Updated: October 10, 2025Welcome to Tr33man Charts (“we,” “our,” “us”). By purchasing or accessing any of our products, including TradingView indicators and related tools (the “Services”), you agree to these Terms of Service (“Terms”). Please read them carefully before making a purchase.1. EligibilityYou must be at least 18 years old to use our Services. By purchasing, you represent that all information you provide is accurate and complete.2. Product DeliveryAfter purchase, you’ll receive a link to a form requesting your TradingView username. Once submitted, we will manually grant access to the purchased indicator(s) on TradingView within 24–48 hours.3. License & UsageAll indicators and scripts are licensed for personal use only. Redistribution, reselling, or sharing of access is strictly prohibited.
You may not copy, reverse-engineer, or repackage any part of our scripts or source code.4. Payments & SubscriptionsPayments are processed securely through our third-party payment providers.
Some products may include recurring billing. You may cancel at any time through your account or by contacting support before your next renewal date.5. RefundsRefunds are handled case by case, as described in our Refund Policy.6. Intellectual PropertyAll products, names, and materials provided through Tr33man Charts are the property of Tr33man Charts and are protected by copyright and intellectual property laws.7. Limitation of LiabilityTrading involves risk. Our indicators are for educational and informational purposes only and do not constitute financial advice.
We are not liable for any financial losses, errors, or damages resulting from use of our indicators or data.8. Changes to TermsWe may update these Terms at any time. Updates will be reflected on this page with a revised “Effective Date.”9. ContactIf you have any questions about these Terms, please contact us at:
📧 [email protected]
Privacy Policy
Effective Date: October 10, 2025This Privacy Policy describes how Tr33man Charts (“we,” “our,” “us”) collects, uses, and protects your personal information.1. Information We Collect
• Order details: Name, email, and order ID from payment provider.
• TradingView username: Submitted via a form for product activation.
• Optional information: If you contact support, we may retain communication for customer service purposes.2. How We Use InformationWe use the information collected to:
• Fulfill and deliver your order.
• Grant access to TradingView indicators.
• Provide customer support.
• Send important updates regarding your product or account.We do not sell or share your personal data with third parties, except as required to process payments or comply with legal obligations.3. Data RetentionWe keep records as long as your product access remains active or as needed for legal/accounting purposes.4. CookiesOur website may use basic cookies for functionality and analytics.5. Your RightsYou may request correction or deletion of your data at any time by contacting [email protected].6. Data SecurityWe use secure payment processors and protect all collected data through encryption and restricted access.7. Changes to PolicyWe may update this policy periodically. Any changes will be posted here with an updated effective date.
Refund Policy